Monitoring Tool reviews from Reddit
Summary
We analyzed 184 Reddit reviews across 26 subreddits and 44 posts to rank the best Monitoring Tool brands recommended by redditors, including communities like r/devops, r/networking, r/sysadmin, r/socialmedia, r/Proxmox. Top-rated brands include Datadog (2.5/5), Zabbix (4.2/5), Grafana (4.9/5).
Stats
Reviews184
Subreddits26
Posts44
Brands86
Products34
184 reviews from
and
By Brand
/By Product
#1
Datadog
2.5
(34)
"My account rep at Datadog is excellent. Every month walks me through detailed drawdown reports, takes assiduous notes on features requests and feedback, passes them to actual engineers, and in turn I get to move the needle in my direction and the product itself is excellent."
"We use Terraform/Terragrunt to manage our DataDog monitoring using MaC principles."
"If your org can afford it Datadog is relatively easy and reliable."
"I just started with signoz a few weeks ago and found their query builder amazing."
"Datadog is expensive but I’m a big fan of their tooling."
"We're paying about $800/month for datadog with APM, dashboards, and logging."
"IMO Datadog is miles ahead of Cloudwatch in terms of UX."
"Datadog is so far beyond everyone else. It's REALLY hard not to go with them."
"We pay datadog for everything. It is a huge cost, but you get what you pay for. Single pane of glass into session replays, custom metrics, logs - everything."
"Datadog logging is cheap and has a lot of features."
#2
Zabbix
4.2
(10)
"Zabbix effectively monitors the availability and performance of network equipment."
"Zabbix is great for monitoring end and network devices."
"I use Zabbix in production for enterprise monitoring."
"Zabbix is highly recommended & popular solution."
"The learning curve for the discovery of devices and then adding templates can be daunting, but it’s great after that."
"Zabbix is a dedicated monitoring solution that works well in its own VM."
"It's pretty straightforward to setup, and the learning curve is much less steep than Nagios/Icinga2."
"Zabbix"
"Zabbix might be the way to go."
"Incorrect information about Zabbix using Java."
#3
Grafana
4.9
(8)
"Grafana offers excellent visualization capabilities for the metrics collected by Prometheus."
"Grafana provides excellent visualization capabilities for InfluxDB."
"Grafana can use multiple data sources and provides great visualization."
"I use Grafana for dashboards."
"I like Influx + Grafana for monitoring."
"It pushes metrics (prometheus format) to a remote host. It works really well."
"Grafana works well with Graphite and Graylog for monitoring."
"Grafana Agent. Open source, based on on Prometheus."
#4
Netdata
4.5
(6)
"Netdata provides a comprehensive monitoring solution with easy installation and integration with Prometheus and Grafana."
"Netdata is also mature on FreeBSD and is worth looking into."
"Ideal for plug and play setup."
"Take a look at netdata."
"Netdata"
"[Netdata] is nice, you have to map the docker socket into the container."
#5
PRTG
4.0
(6)
"PRTG offers a variety of sensors for effective network monitoring."
"PRTG is nice. We use it to monitor more than 150 servers."
"Solarwinds, PRTG, ntopng+libre NMS if you want open source or many others can all get the snmp stats."
"You might consider Lansweeper, Pandora FMS, PRTG, or Spiceworks."
"Prtg"
"PRTG and any other 'freeish' tool is going to require quite a bit of configuration on your part for any device you want to monitor."
#6
Sprout Social
4.0
(5)
"Sprout Social for user-friendly reporting and engagement"
"Sprout Social can help you track your performance effectively"
"Sprout has a listening component that we use."
"Sprout Social has solid analytics features."
"Sprout Social has excellent analytics and user interface."
#7
Hootsuite
4.0
(5)
"Hootsuite for all-in-one management"
"Hootsuite or Sprout Social? They cover a ton of social platforms"
"I have heard lots about the Hootsuite."
"Have you checked out tools like Hootsuite or Sprout Social?"
"Hootsuite offers a wide range of features for social media management."
#8
iStat Menus
4.7
(3)
"IStat menus has something that Stats doesn't: long-term data graphs."
"Incredible detail and it lets me easily see what my computer is doing at all times."
"IStat Menus"
#9
Prometheus
4.7
(3)
"Prometheus is a powerful time series database that works seamlessly with Netdata for metric collection."
"Deployment with Ansible is pretty easy."
"Prometheus and grafana - maybe an overkill."
#10
Domotz
4.3
(3)
"Domotz can help with this: [www.domotz.com](http://www.domotz.com) by agent on a network (rather than each device)."
"Domotz is relatively cheap and easy to use."
"Domotz is another option comparable to PRTG and Auvik."
#11
Proxmox
4.3
(3)
"Proxmox integration with InfluxDB is seamless and efficient."
"Proxmox itself will log data to the Influx database."
"Proxmox is an excellent hypervisor for hosting VMs."
#12
Sentry
4.0
(3)
"Sentry? why not?"
"Sentry"
"Sentry is highly praised for its features."
#13
Brandwatch
4.0
(3)
"Brandwatch for deep analytics"
"Brandwatch provides deep analytics for social media."
"Brandwatch is top of the line but expensive."
#14
Talkwalker
4.0
(3)
"Talkwalker is quite good."
"Talkwalker and Mentionlytics for social media monitoring"
"Talkwalker is quite good."
#15
Lansweeper
3.7
(3)
"You might consider Lansweeper, Pandora FMS, PRTG, or Spiceworks."
"Perhaps better(?) is Lansweeper, it also captures this and perhaps is a bit more 'focused'."
"Maybe Lansweeper LsPush with Cloud."
#16
FreshPorts
5.0
(2)
"I found ztop useful."
"I found atop useful."
#17
InfluxDB
5.0
(2)
"InfluxDB is perfect for handling time series data."
"InfluxDB is fast and efficient as a time-series database."
#18
CheckMK
4.5
(2)
"We monitor hundreds of servers (Linux and Windows) with it."
"My favorite monitoring software is Checkmk."
#19
ManageEngine
4.5
(2)
"ManageEngine's OpManager is highly recommended for network management!"
"On par with Solarwinds without all the um.... Backdoors."
#20
LibreNMS
4.5
(2)
"LibreNMS is highly recommended."
"LibreNMS is a great freeware option."
#21
Telegraf
4.5
(2)
"Telegraf is incredibly useful with hundreds of plugins for monitoring."
"You can also install telegraf or something inside your VMs to have them log their own state to Influx."
#22
Webmin
4.5
(2)
"Webmin provides a Web interface that allows management of almost everything on a *nix server."
"It's easy to install and works well."
#23
Activtrak
4.5
(2)
"Workforce Analytics & Productivity
https://activtrak.com"
"Activtrak is good for most of that stuff."
#24
Microsoft
4.5
(2)
"Microsoft Clarity is pretty nice. It records what the users are doing and you can play it back."
"If you have budget and are a majority windows shop then SCOM is probably the answer, integrated with grafana for visualisations and dashboards."
#25
ManageEngine OpManager
4.0
(2)
"You can checkout OpManager by ManageEngine."
"OpManager!"
#26
NetXMS
4.0
(2)
"We use for exactly the same purposes NetXMS."
"NetXMS allows monitoring networking and all the hosts connected."
#27
Pulsetic
4.0
(2)
"Try Pulsetic maybe?"
"I use the Pulsetic. Maybe could be a solution for you."
#28
ThousandEyes
4.0
(2)
"We do have some tools like thousandeyes/dnsperf/site24x7 whitch gives a good approach of how internet can reach us."
"You're looking for something like ThousandEyes or any other 'digital experience monitoring' agent solution."
#29
Cisco
4.0
(2)
"Using Cisco routers with IP SLA for traffic monitoring is a practical solution."
"You are looking for something like ZScaler ZIA or Umbrella from Cisco"
#30
Veriato
3.5
(2)
"Nice reports, drill down by app."
"Activtrak is good for most of that stuff, but it won't do keystrokes."
#31
SolarWinds Orion
5.0
(1)
"Solarwinds Orion software"
#32
API Toolkit
5.0
(1)
"APItoolkit.io is another affordable API monitoring and observability tool that even has a free plan."
#33
UptimeRobot
5.0
(1)
"Using Uptime Robot for this since it has a free plan."
#34
Tea-n-Tech
5.0
(1)
"Easy to start, solidly engineered, and has been working very good for us."
#35
Centreon
5.0
(1)
"Centreon with check_by_ssh could work great"
#36
Firstwave
5.0
(1)
"NMIS is an open-source tool that provides unlimited SNMP monitoring and sends alerts on useful metrics."
#37
Elasticsearch
5.0
(1)
"ELK is great for monitoring and analyzing pfSense firewall events."
#38
Nagios
5.0
(1)
"I use Nagios/Icinga2 agents on all of my Linux nodes and a self-made Grafana dashboard."
#39
Retzkek
5.0
(1)
"I use chiamon by retzkek. You can find it on Github."
#40
Philipp Normann
5.0
(1)
"I really like this chia-monitor and have been using it for quite some time now."
#41
Checkmk
5.0
(1)
"Checkmk and checkmk agent on the end device? Raw edition is free."
#42
Xchdashboard.com
5.0
(1)
"Provides essential earning statistics independent of the pool."
#43
Thousand Eyes
5.0
(1)
"Thousand Eyes is your friend."
#44
AppNeta
5.0
(1)
"AppNeta is probably best in class for this exactly."
#45
Influx
5.0
(1)
"I like Influx + Grafana for monitoring."
#46
Software-defined storage
5.0
(1)
"Software-defined storage is the future because hardware RAID is dead."
#47
Polybar
5.0
(1)
"You can use polybar for your status bar needs."
#48
SurveySparrow
5.0
(1)
"Highly recommend it for its features and affordability!"
#49
42signals
5.0
(1)
"It covers a wide range of platforms including Twitter, TikTok, YouTube, and Reddit. It’s great for tracking brand mentions and provides comprehensive monitoring and insights."
#50
Uptime-Kuma
5.0
(1)
"I like Uptime-Kuma."
#51
htop
5.0
(1)
"Htop is a better top"
#52
GummySearch
5.0
(1)
"GummySearch is a great tool for monitoring keywords on Reddit, helping users find online communities."
#53
Pulseway
5.0
(1)
"Pulseway offers a free version that is easy to sign up for."
#54
Conky
4.0
(1)
"I wrote a small monitor that allows me to monitor some aspects of my server farm. I have these displayed with conky."
#55
Cloudflare One
4.0
(1)
"CloudFlare One Zero Trust includes Digital Experience Monitoring."
#56
SolarWinds
4.0
(1)
"Solarwinds, PRTG, ntopng+libre NMS if you want open source or many others can all get the snmp stats."
#57
ntopng
4.0
(1)
"Solarwinds, PRTG, ntopng+libre NMS if you want open source or many others can all get the snmp stats."
#58
MageWorx SEO Ultimate
4.0
(1)
"Look at MageWorx SEO Ultimate"
#59
OpManager
4.0
(1)
"I believe a product like OpManager would work for you."
#60
Apitally
4.0
(1)
"I'm using [Apitally](https://apitally.io) for monitoring my SaaS / APIs"
#61
Zscaler
4.0
(1)
"You are looking for something like ZScaler ZIA or Umbrella from Cisco"
#62
DNSFilter
4.0
(1)
"I have seen people recommend DNSfilter here as well"
#63
Pandora FMS
4.0
(1)
"You might consider Lansweeper, Pandora FMS, PRTG, or Spiceworks."
#64
Spiceworks
4.0
(1)
"You might consider Lansweeper, Pandora FMS, PRTG, or Spiceworks."
#65
InfluxData
4.0
(1)
"Outputting Telegraf data directly to Prometheus is a great option."
#66
Topng
4.0
(1)
"Topng provides detailed insights into user activities on the network."
#67
Snort
4.0
(1)
"Snort is a reliable IDS for network security."
#68
HealBe
4.0
(1)
"The HealBe GoBe 3 is accurate compared to my blood pressure cuff and monitors hydration, which is rare in smartwatches."
#69
NetFlow Tool
4.0
(1)
"This tool effectively displays netflow data, providing insights beyond just busy percentages."
#70
Fing
4.0
(1)
"Android can run traceroute. Check out Fing app."
#71
Node Exporter
4.0
(1)
"Node Exporter provides a good mix of metrics by default, making it a solid choice for monitoring."
#72
Uptime Robot
4.0
(1)
"Uptime Robot is my go-to, but curious about your service"
#73
Bugsnag
4.0
(1)
"Bugsnag is a reliable error monitoring tool."
#74
Meltwater
4.0
(1)
"Meltwater is reliable for PR and communication monitoring."
#75
PA-Ping
4.0
(1)
"PA-Ping is free and effective for ping monitoring."
#76
PA Server Monitor
4.0
(1)
"PA Server Monitor offers more features and has a free 30-day trial."
#77
Monit
4.0
(1)
"I use Monit as a self-hosted monitoring tool."
#78
Observium
4.0
(1)
"Observium is free and open source and can run in a simple docker container or small linux VM."
#79
Sprinklr
4.0
(1)
"Sprinklr is top of the line but expensive."
#80
Amazeful
4.0
(1)
"Amazeful is a great tool for monitoring Facebook and Google."
#81
Auvik
4.0
(1)
"We are trying out Auvik for this on a smaller scale. Has WMI capabilities. Good luck!"
#82
7Signal
4.0
(1)
"7Signal is great at this."
#83
CAdvisor
3.0
(1)
"Maybe CAdvisor?"
#84
No-IP
3.0
(1)
"Maybe noip.com ? Not sure if they do alerts but they can auto update your DNS when your IP changes"
#85
WebTitan
3.0
(1)
"There are others out there like Web Titan or Baracuda"
#86
Cloudflare
3.0
(1)
"Cloudflare has an offering for up to 50 people I believe"
Discover your audience
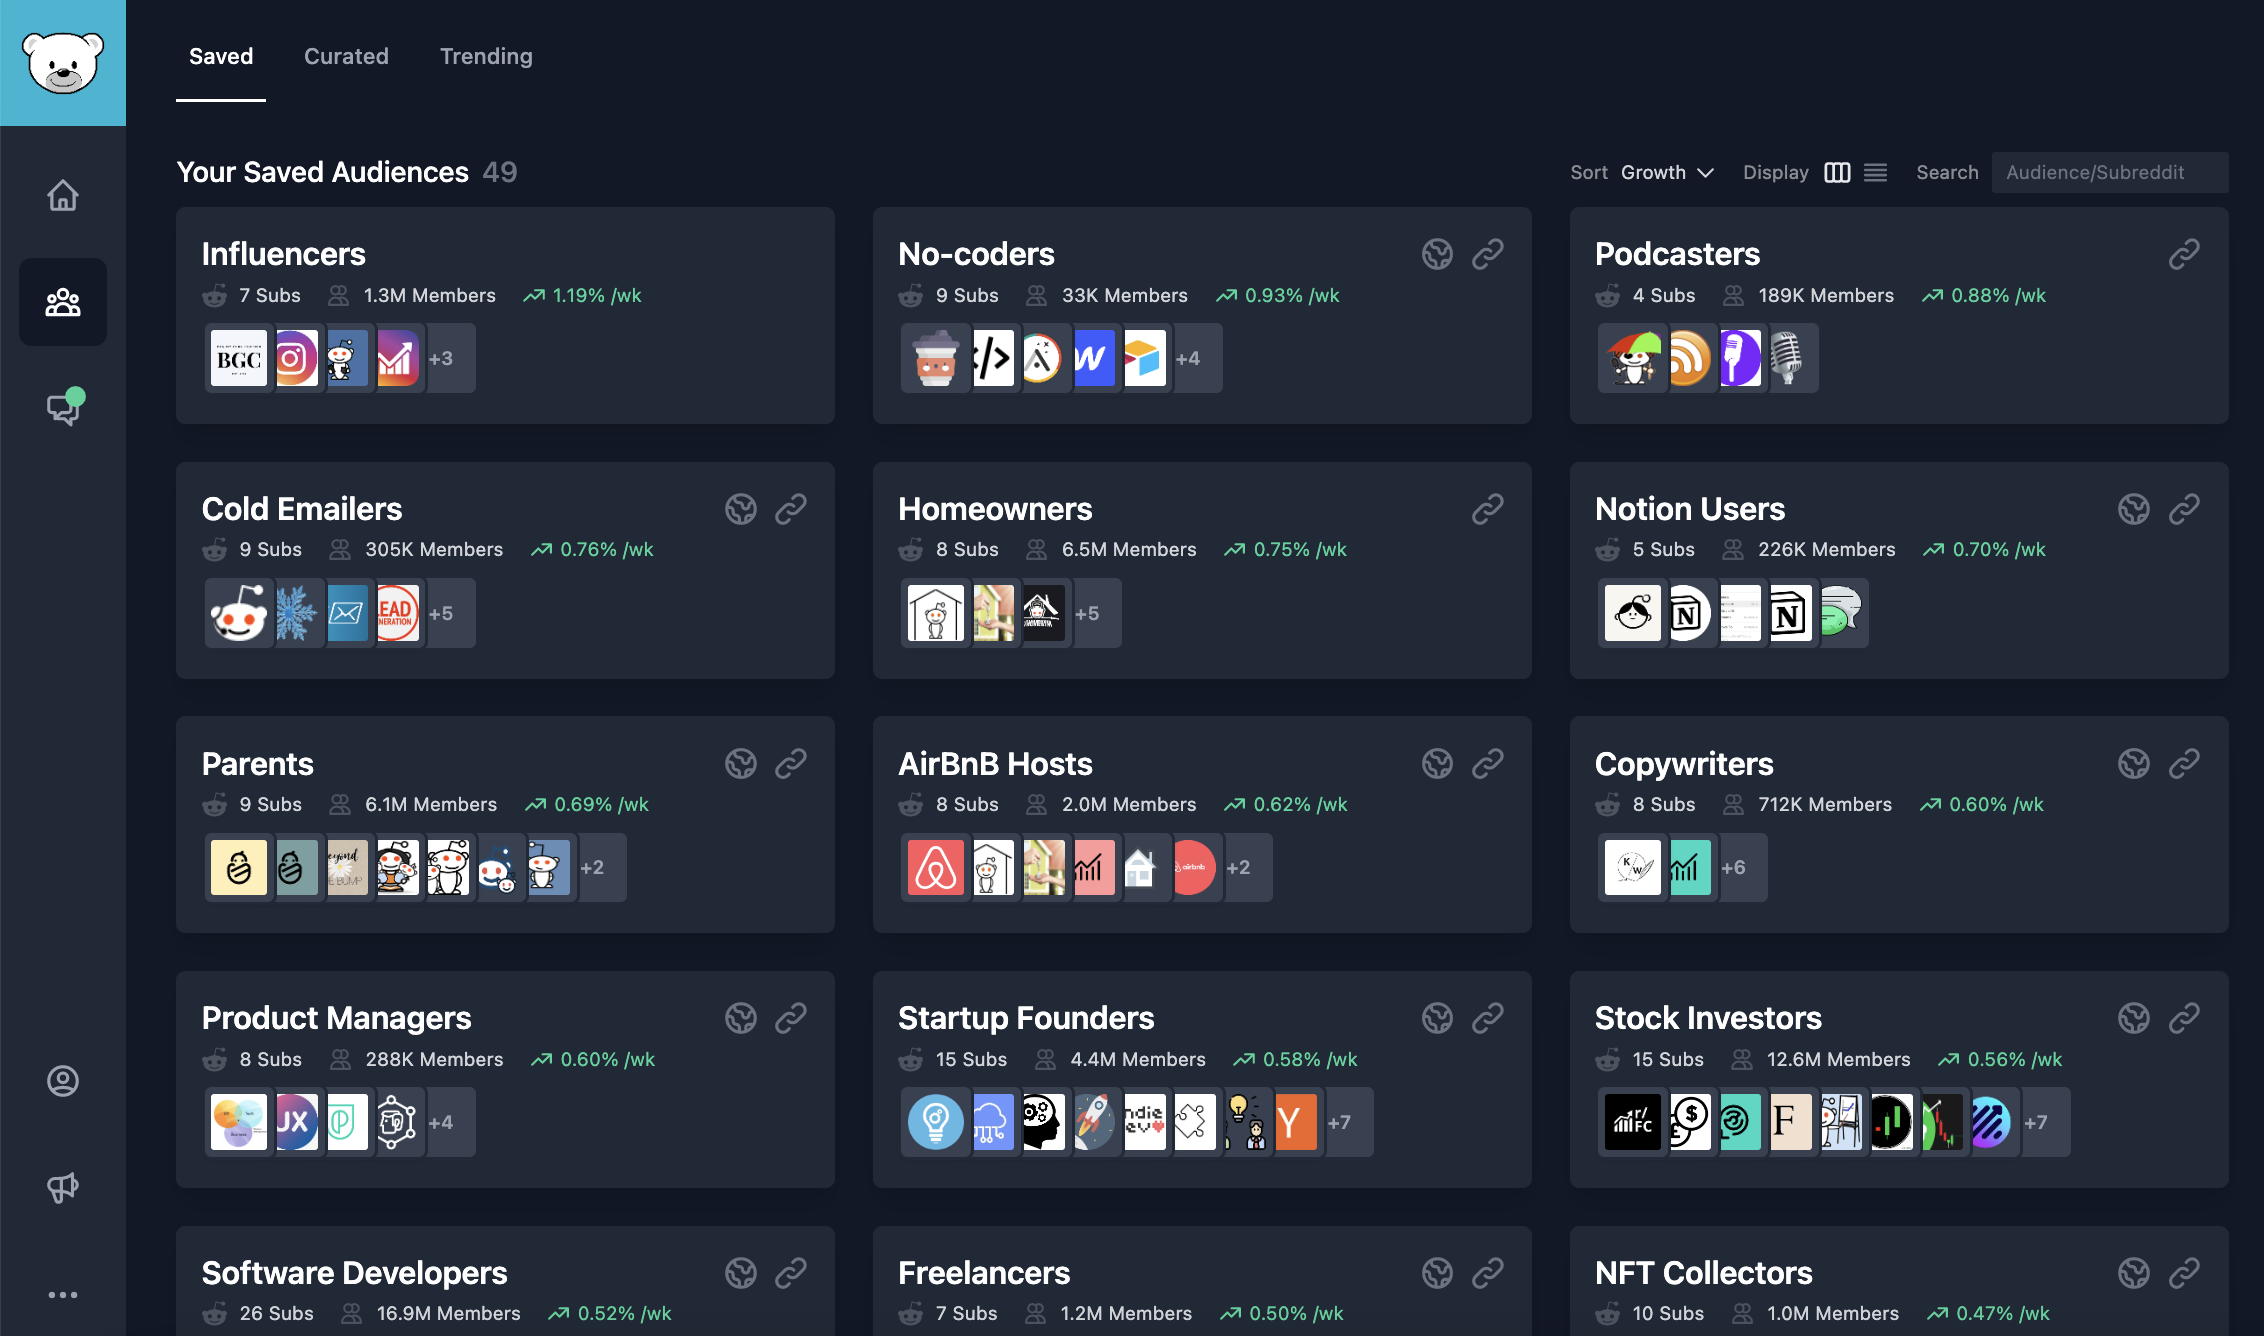
GummySearch is an audience research toolkit for 130,000 unique communities on Reddit.
If you are looking for startup problems to solve, want to validate your idea or find your customers online, GummySearch is for you.
Sign up for free, get community insights in minutes.
Tell me more
Get started